An Analysis of Data Traffic in Cellular Networks Caused by
Inter-Vehicle Communication at Intersections
The paper was published at the IEEE Intelligent Vehicles Symposium 2011 (IV 2011) in Baden-Baden, Germany
Results:
Cell Size - Technology Comparison
Cell Size - Provider Comparison
Amount of Street km per Cell
Amount of Vehicles per Cell
Influence of random antenna direction start on results:
Cell Size - Random Influence
Amount of Street km per Cell - Random Influence
Amount of Vehicles per Cell - Random Influence
In the following, you can find the Voronoi graphs that have been generated to get hold of cell shape information and being used in the Paper. The provided visualization allows to judge the data quality and the distribution of cells of different sizes. Cells that have been excluded from evaluation (the exclusion critera are described in the paper) are not colored (transparent). A click on a cell will reveal its size.
To access the data, open the linked kml in Google Earth. You will find a placemark located near to the City of Munich. It's description popup contains links to the single Voronoi graphs for each cellular network.

If you do not have Google Earth yet:
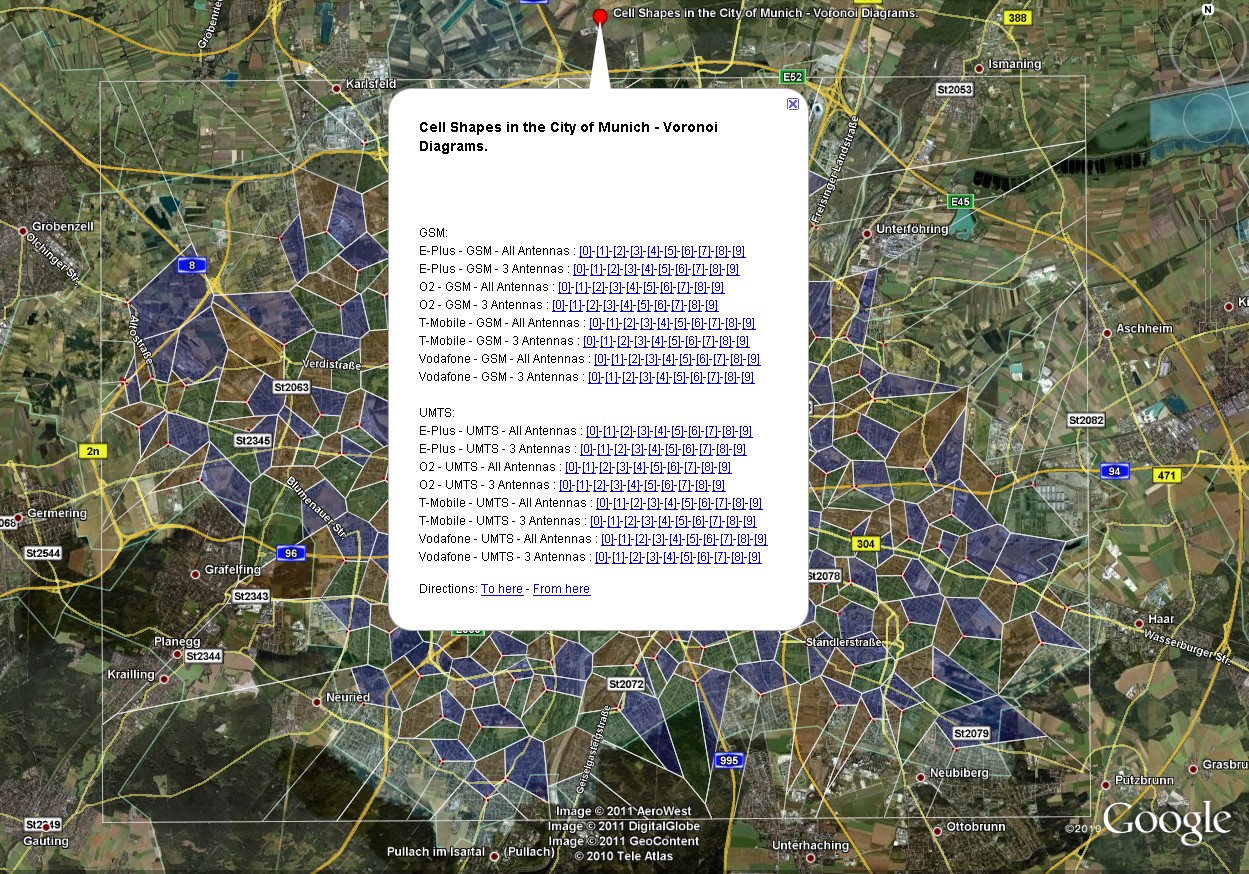
Google Earth screenshot showing the visualization. The info box of the placemark on top contains the links to the kml visualization of single networks.
This research was executed by Thomas Mangel at BMW Group Research and Technology, in 2010/2011. Thanks for hosting goes to the Decentralized Systems and Network Services Research Group at the Karlsruhe Institute of Technology.