5.9GHz IEEE 802.11p Inter-Vehicle Communication:
Non-Line-Of-Sight Reception under Competition
In the paper, an investigation about the origin of signals that interfere with an ongoing reception was left to this website due to space limitations.
To investigate the origin of interfering signals, we modified the simulator as follows: When a signal arrives and another packet is currently decoded:
1. A destroy event is logged when the new signal destroys the packet (therefore, when it lowers the remaining SINR below the value needed for decoding).
2. An interference event is logged if the new signal would lower the initial SINR value at decoding start (in dB) by more than 10%.
For example:
| Signal Power | Interference Noise Level | SINR | |
| -60dBm=10-6 mW | -80dBm=10-8 mW | 20dB | Currently decoded packet - at decoding start. |
| -70dBm=10-7 mW | -69.6dBm=1.1*10-7 mW | 10.4dB | Interfering packet - Initial packet still decodable (10.4 SINR > 8) |
| (new level: old level + new signal) | Interfering packet cut 9.6/20=48% of initial SINR margin |
For each of these two events, the position of the transmitter of the interfering signal is logged.
In the evaluation, for all packets (from the three static transmitters) received in a certain region, a statistic is generated. The regions are +-20m around center, 20-60 and 60-100 meter into each side street. The statistic separates between the interfering signals originating from the street in LOS or NLOS to the transmitter of the decoded message. This is visualized in the following figure:
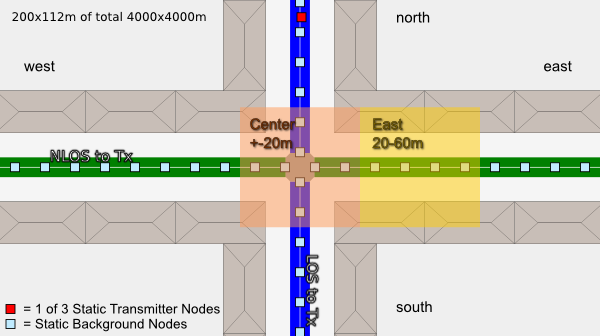 |
Strong Reception Rate Drop in Intersection Center - Origin of Interference.
We found in the paper that reception rates in the intersection center---a region in LOS to both streets---drop by 0.2-0.3 rate points. While the competition is on a high level in the center, and much higher as in one side street, the drop is nevertheless probably stronger than excepted.
The following 2 figures show the spatial distribution of interference origin for a transmitter<->center distance of 100m and all packets received in +/-20m to intersection center. All plots show the static scenario with a 4Hz message transmission rate at the background nodes. The left figure shows the distribution for interfering and destroying signals, while the right one only covers the destroying ones. Color coding is same as in the top view image above.


First of all, it is obvious that the interfering signals originate almost 100% from the NLOS street. This proves our assumption that the strong drop in power in the crossing street (due to NLOS) will provoke collisions: the nodes in the crossing street (west-east) assume that the channel is free, as they do not sense the transmission originating from the north street leg. When they transmit, assuming the channel is free, their signals will destroy ongoing receptions in the intersection center (a region in LOS to the initial transmitter).
While the position of interfering components is distributed over the whole NLOS street, destroying signals originate more likely from regions close to the center. This is not surprising, as the initial signal being decoded in the center is strong (only 100m from transmitter to receiver). An interfering signal needs to be relatively strong to destroy such an ongoing reception. Therefore, the distance to center must not be too high.
Another assumption is unfortunately not visible here: One would assume that interfering components do not originate from the center region (both streets). There is a slight dip in the center -100 to 100m bin, but the value is not close to 0. This is mainly as the NLOS region starts at about 25 meter from center in our setup. Therefore, the center bin covers 75% NLOS regions. Smaller bins were problematic however, as the amount of destructions and therefore interference information is not high enough to provide stable enough statistics. As trace-file sizes already reached 7GB, we did not increased the simulation time of 60s to enable higher statistic stability.
Strong Reception Rate Drop in NLOS Regions - Origin of Interference.
We concluded in the paper from the asynchronous load scenario results that NLOS recepetion rate drop due to interference is most dependent on the network load in the NLOS receiver street canyon.
The following two plots show that our explanation, being that interfering signals must be strong, and will therefore originate more likely from the same street canyon as the receiver, is correct.
The plots show the same information as above, but for receptions in the 20-60m east street stretch (which is mostly in NLOS) and a transmitter to center distance of 50 meter (higher drop due to interference in NLOS compared to 100m results).


The plots reveal that for NLOS receptions, interfering signals originate almost completely from the street canyon the NLOS receiver is placed in. In consequence, if load is high there, NLOS recepetion rates will suffer most, as it could be seen in the paper in the "high_crossing" scenario results.
The plots prove our explanation. It is extremely unlikely that a node inside the same street canyon as the evaluated transmitter (in LOS) falsely assumes the channel is free and the power of its transmission is high enough in NLOS to destroy the ongoing NLOS reception.
This research was executed by Thomas Mangel at BMW Group Research and Technology, in 2011. Thanks for hosting goes to the Decentralized Systems and Network Services Research Group at the Karlsruhe Institute of Technology.